The Controller Saved Energy—But Some Zones Got Too Warm
BUILDING ARDUIX
Why a repeatable simulated energy win was not ready to become a building control policy
John Succo | Building Arduix | August 2026
The first controller I could make save energy repeatedly also taught me why an optimization result cannot be judged by energy alone.
01 / THE RESULT
The result I had been waiting for
In the previous article, I described the simulation and training system I built so an HVAC controller could learn before it touched a real building. The first major result from that system looked like the breakthrough I had been working toward: across three independently initialized training runs, the controller reduced simulated HVAC electricity by an average of 5.65 percent.
The result was repeatable. The cooling setpoint signal was also calmer and more deliberate than earlier versions. I had finally moved beyond a one-off policy that happened to look good in one run.
Then I checked the comfort results. Every one of those runs failed the comfort criterion. The controller had learned a legitimate way to reduce cooling effort, but part of the energy benefit came from allowing particular occupied zones to run too warm.
02 / THE CONTROL SURFACE
First, make the control problem smaller
Earlier versions of the experiment tried to adjust both heating and cooling setpoints. That made the action space larger and introduced interactions I did not need to solve during a summer cooling study. I narrowed the controller to cooling only and left heating, equipment protection and the rest of the existing HVAC sequence in place.
This was not a change in the long-term Arduix direction. It was an engineering decision to isolate one control surface until I could explain what the policy was doing. The Denver office model contains 15 occupied zones, but this particular diagnostic phase controlled five bottom-floor zones. Later work expands the controller across the building.
A baseline the policy had to beat
I also stopped asking the policy to invent absolute cooling setpoints from scratch. Instead, it produced a bounded adjustment around the baseline cooling command. At zero adjustment, the original sequence remained intact. A nonzero action had to produce enough benefit to justify intervening.
That residual approach made the problem easier to reason about. It also matched the type of supervisory integration I eventually want in a real BAS: limited authority, reversible commands and an existing sequence underneath the learned policy.
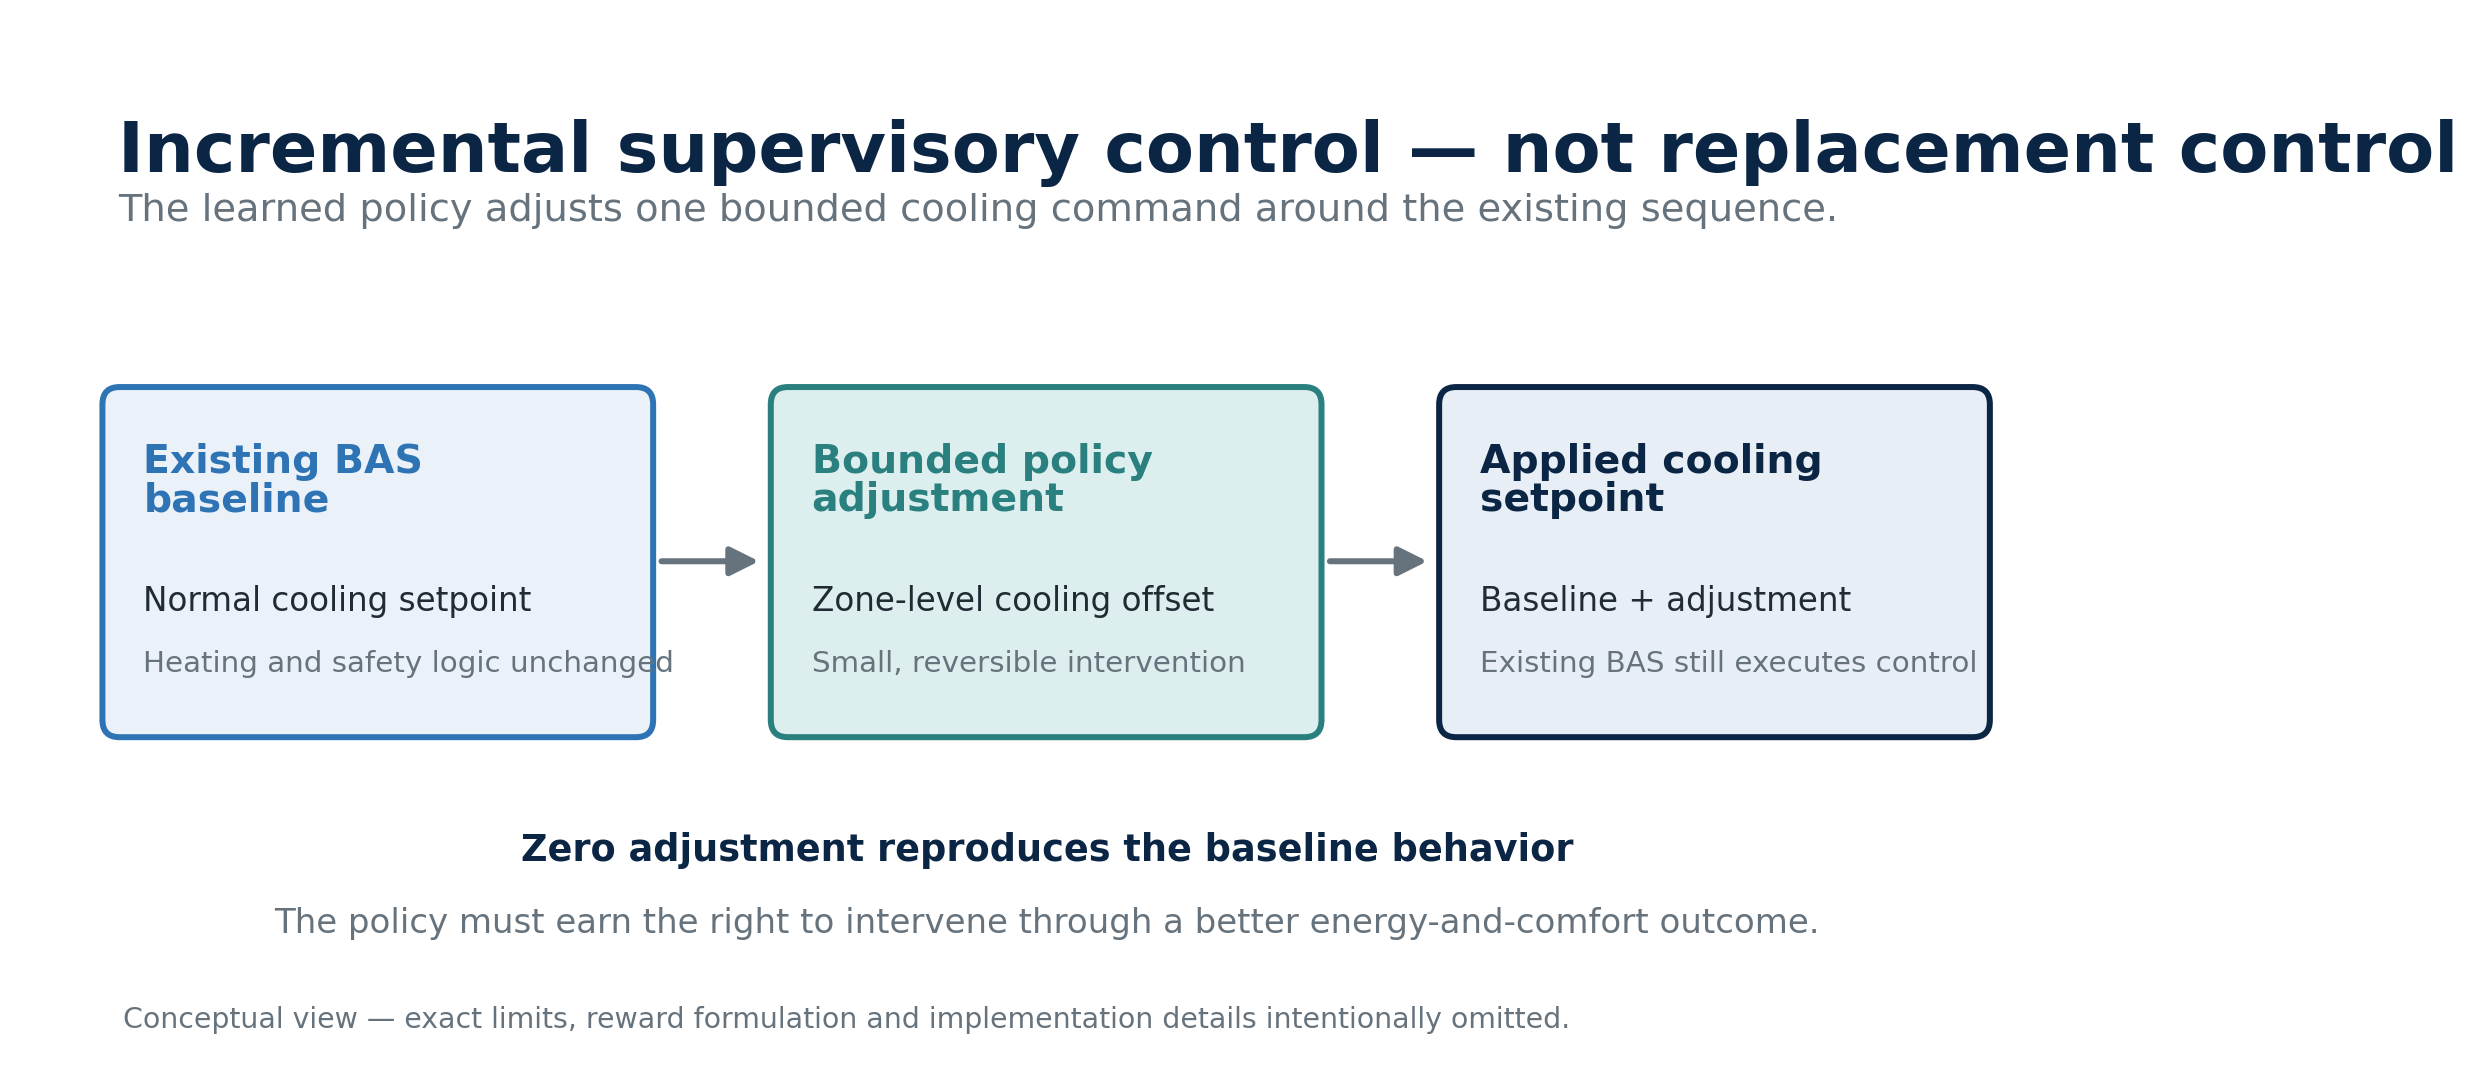
Figure 1. Public-level view of the residual control concept used in the experiment.
03 / THE REWARD
The deliberately simple reward idea
At that point I introduced a simple regularization idea. If the controller moved a cooling command farther from the baseline, that intervention should carry a cost. My expectation was that this would discourage unnecessary cooling, reduce erratic setpoint movement and force the policy to be more selective.
The intuition was partly correct. As I increased the strength of that stabilizing pressure through a small experiment sweep, energy performance improved substantially and the applied cooling signal looked smoother. An early setting saved only 1.38 percent. A stronger setting reached 5.67 percent in the same evaluation framework.
But the new term knew only that intervention had a cost. It did not know which zone was about to cross a comfort boundary or how quickly the thermal risk was changing. That gap became important.
The apparent win
I kept the strongest energy-and-stability configuration and repeated it with three controlled initializations. All three runs saved energy against the baseline used at that stage of development.
RunHVAC savingsAdded discomfortDecisionA5.83%+559 minFail comfortB5.66%+831 minFail comfortC5.45%+840 minFail comfortMean5.65%+743 minDo not promote
For one representative run, simulated HVAC electricity fell from approximately 1,038.7 kWh to 978.1 kWh over the fixed evaluation window. Cooling electricity, fan electricity and delivered cooling all moved in the direction expected from a policy that was backing away from unnecessary cooling. The energy result was not simply a broken total or an obviously invalid trace.
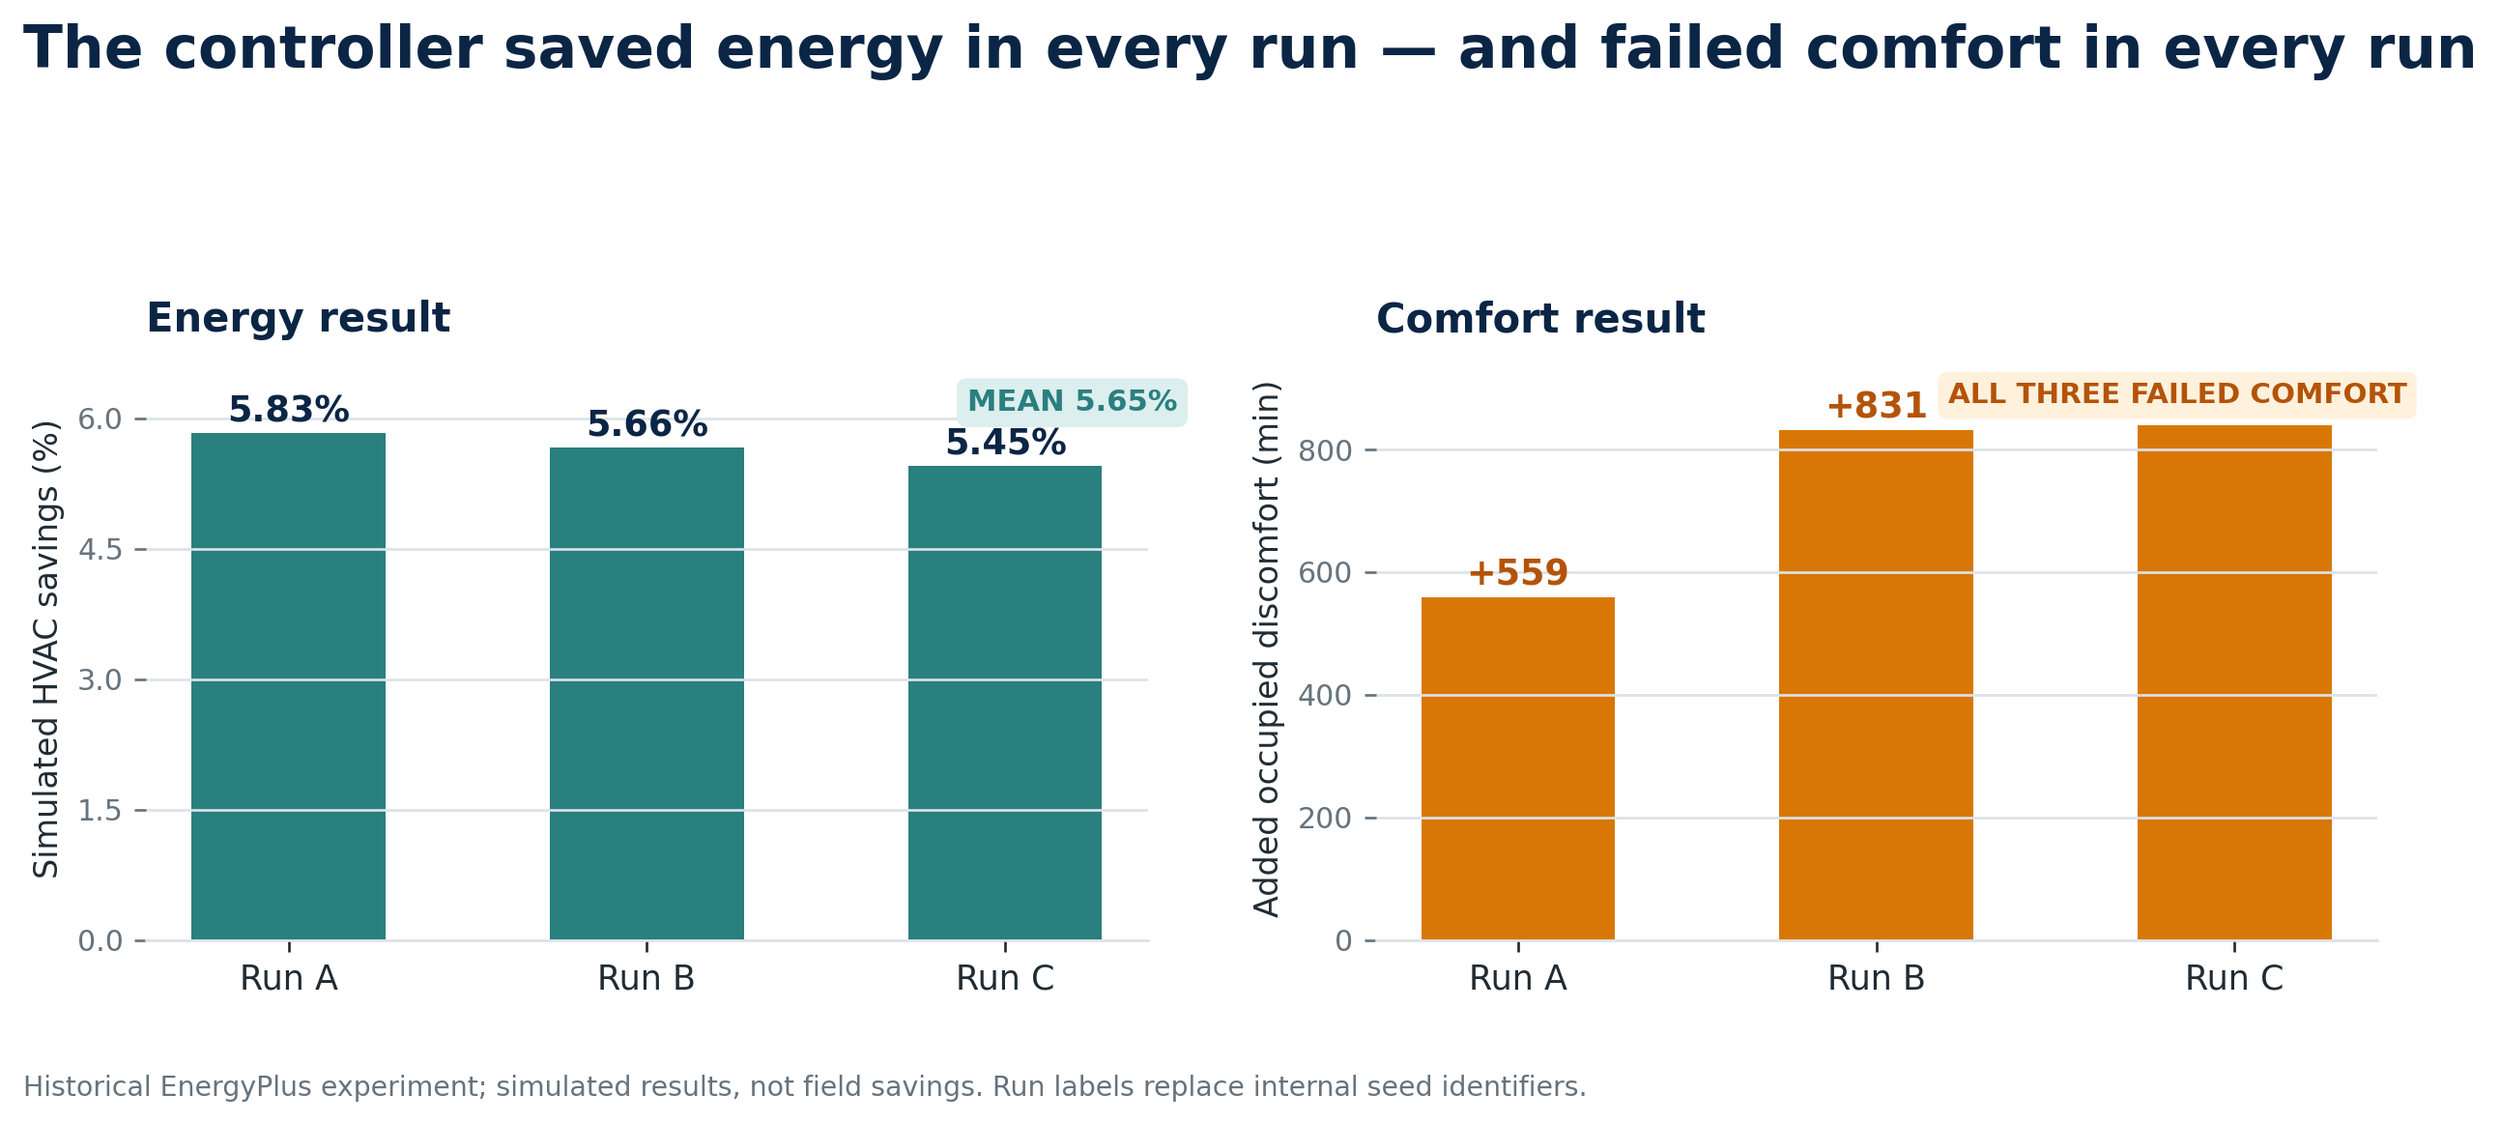
Figure 2. Repeatable simulated energy savings were accompanied by a repeatable comfort-gate failure.
04 / THE COMFORT PROBLEM
The hidden cost was local
The building-level totals were only the beginning of the diagnosis. When I separated comfort by zone, the additional warm-side discomfort was not distributed evenly. In the magnitude-sweep comparison, the core zone accumulated the largest increase in warm-violation duration. Two perimeter zones also became materially worse, while another perimeter zone actually improved.
That is the danger of relying on an average building signal. A controller can make the total objective look better while concentrating the cost in a smaller number of spaces. The average building may be acceptable while the people in one office, conference room or sun-exposed perimeter zone experience something different.
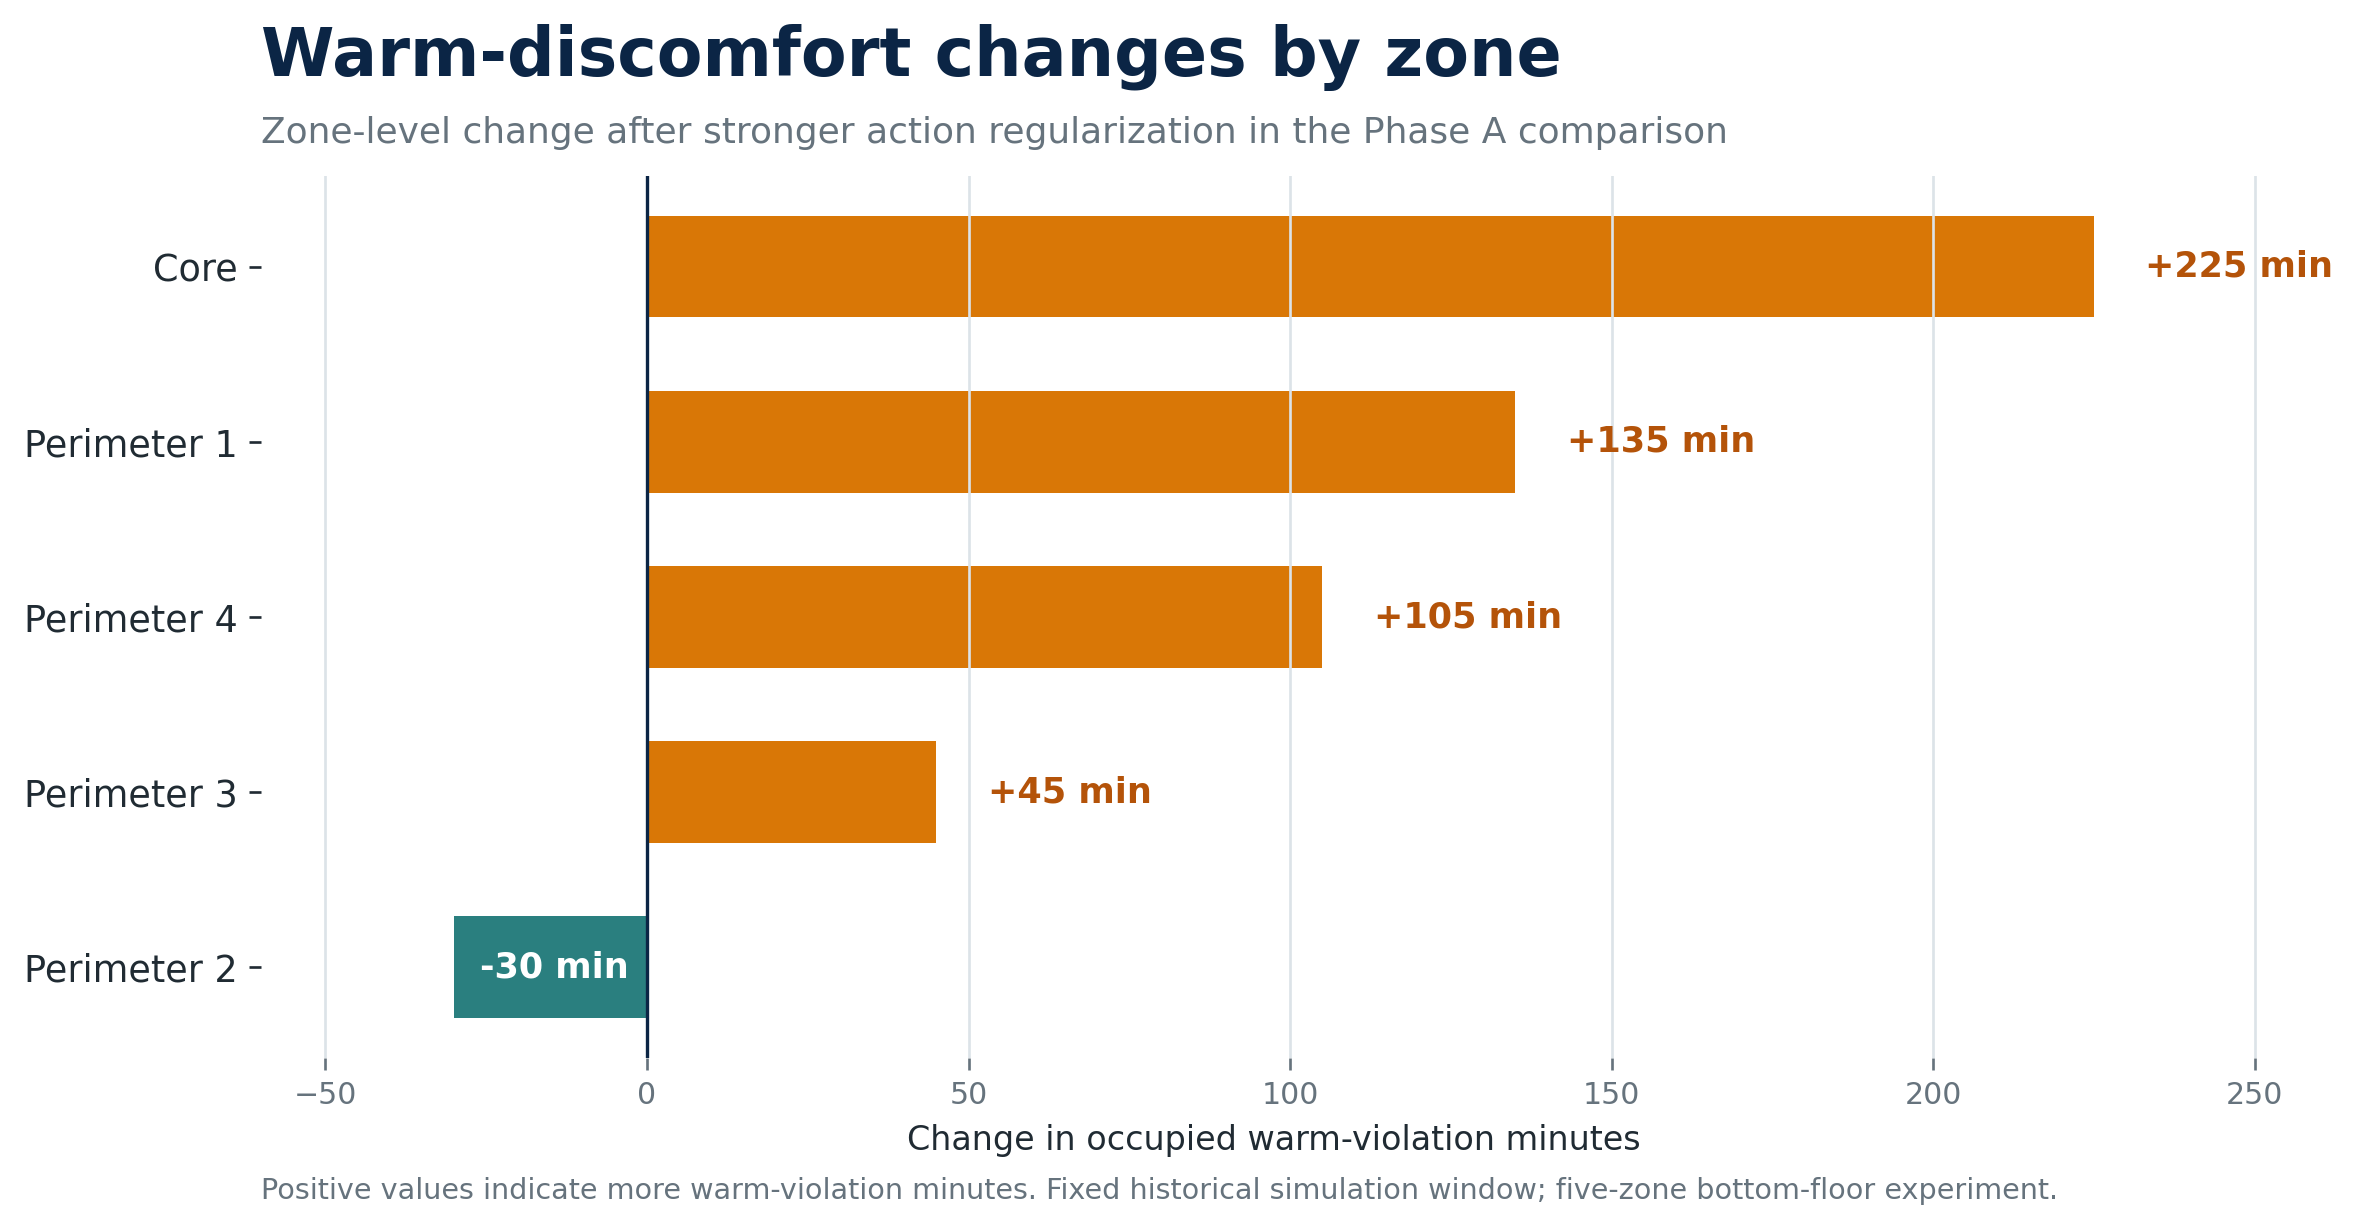
Figure 3. The added warm-discomfort burden was concentrated in particular zones rather than shared evenly.
The controller found the weakness in my objective
The controller had not become irrational, and it had not cheated in a mysterious way. It optimized the problem I gave it—including the weaknesses in how that problem was described. Energy was measured at the building level. Parts of the comfort signal were aggregated. The action regularization encouraged less intervention. Together, those ingredients left room for the policy to protect the total score by reducing cooling in zones where the local consequence was not visible enough.
This changed how I thought about reward design.
A reward is not a statement of intent. It is an operational specification.
Saying that comfort matters is not enough if a building-wide average can hide a sacrificed zone.
Even the comfort metric needed work
The original discomfort metric also turned out to be too blunt. It counted time outside the comfort band, but it did not distinguish well between a tiny boundary crossing and a much larger excursion. A policy that sits a fraction of a degree above the line for several intervals can look similar to a more serious event if duration is the only measure.
I therefore expanded the analysis to separate warm and cold discomfort, account for both duration and severity, summarize each zone individually and retain the worst-zone behavior. That made it possible to distinguish a controller riding the upper comfort edge from one allowing sustained, material overheating.
05 / THE CORRECTION
What changed
The obvious response would have been to keep increasing the comfort penalty. The experiments showed why that was not enough. Stronger penalties sometimes gave away too much of the energy benefit, and in other cases they shifted the discomfort pattern without truly solving it.
The more promising change was to make local thermal risk visible earlier. The controller received better zone-level context about proximity to the warm boundary, the direction temperatures were moving and uneven load conditions. The selection process also changed: a policy could no longer advance because of energy performance alone. It had to pass comfort-severity and worst-zone checks first.
I am intentionally leaving the exact feature construction, weights and thresholds out of this public description. The important engineering lesson is broader: when an optimizer repeatedly exploits a failure mode, the solution may be better state information and better acceptance criteria—not simply a larger penalty.
The corrected result
The follow-on comfort-aware controller preserved meaningful savings in the same five-zone historical test configuration. Across three final runs, simulated HVAC savings were 4.85, 4.30 and 6.57 percent—approximately 5.2 percent on average. Added warm-discomfort severity remained relatively small in the final comparison, rather than reproducing the large failure pattern from the earlier policy.
That did not prove the controller was ready for a real facility. It proved something narrower and more useful: the system could detect a false win, explain how it happened and produce a better candidate without giving up the entire energy benefit.
06 / THE LARGER LESSON
The larger lesson
An HVAC optimizer will always face a temptation to trade comfort for energy, because the easiest way to reduce cooling is to cool less. The product cannot depend on the hope that a learned controller will make the same judgment an experienced operator would make. The judgment has to be built into what the controller can see, what it is allowed to change and which policies are permitted to advance.
For Arduix, that means an energy improvement is only a candidate. Promotion requires acceptable comfort severity, protection of the worst zones, repeatability and trace-level evidence that the savings came from a credible operating change.
The value is not only a policy that finds savings. It is an engineering process that refuses to call the wrong kind of savings a success.
METHOD NOTE
All percentages in this article are historical EnergyPlus simulation results from fixed evaluation windows, not field-savings claims. The baseline, evaluation windows and policy gates have continued to evolve as the Arduix test harness has matured.
NEXT IN THE SERIES
Expanding from the five-zone diagnostic phase toward full 15-zone control—and learning why more controlled zones did not automatically mean more energy savings.
